
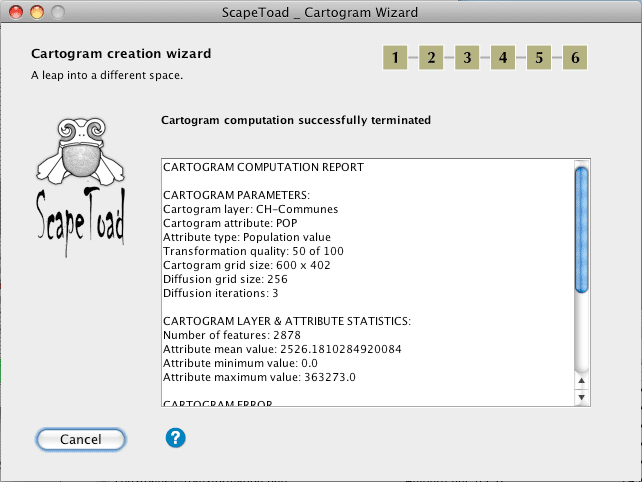
IV - Computation report
The last step of the wizard is computation report, composed of 3 parts:
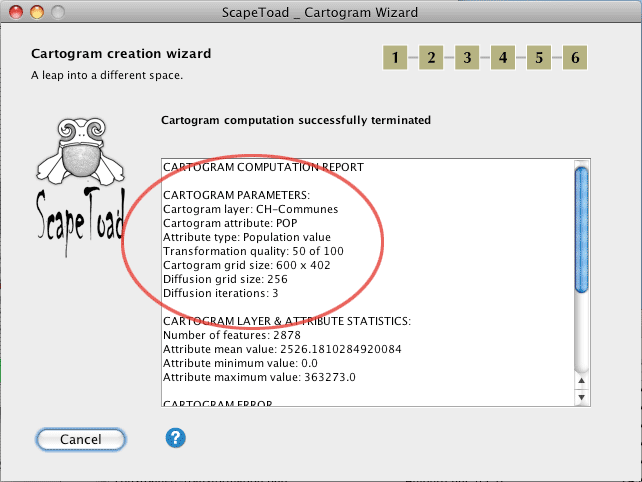
1 - Cartogram parameters
Lists user set and automatic parameters used for the transformation:
- Cartogram layer: Name of the user-chosen transformed layer.
- Cartogram attribute: User-set variable determining the size of the cartogram.
- Attribute type: Type of the statistical variable used in step 3.
- Transformation quality: User-set (slider) general transformation quality, varying between 0 (low quality) and 100 (high quality).
- Cartogram grid size: Grid size used to seize the global transformation, defined automatically or user-set in the advanced options. (see also Advanced options – first grid)
- Diffusion grid size: Size of the grid used by the Gassner/Newmann diffusion algorithm, defined automatically or user-set in the advanced options. (see also Advanced options – second grid).
- Diffusion iterations: Number of runs of the Gassner/Newmann diffusion algorithm, defined automatically or user-set in the advanced options. (see also Advanced options – number of iterations).
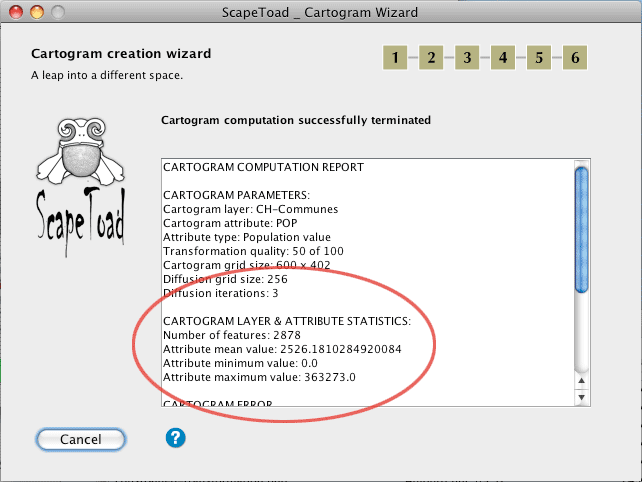
2 - Cartogram layer & attribute statistics
Statistics pertaining to the main polygon layer and to the transformation variable:
- Number of features: Number of polygons on the main polygon layer.
- Attribute mean value: Arithmetic mean of the user-chosen statistical variable.
- Attribute minimum value: Minimal value of the statistical transformation variable. N.B.: Negative values are not allowed. Zero values (which would induce a division-by-zero error in the algorithm) are automatically replaced by very small non-zero values.
- Attribute maximum value: Maximum value of the user-chosen statistical variable.
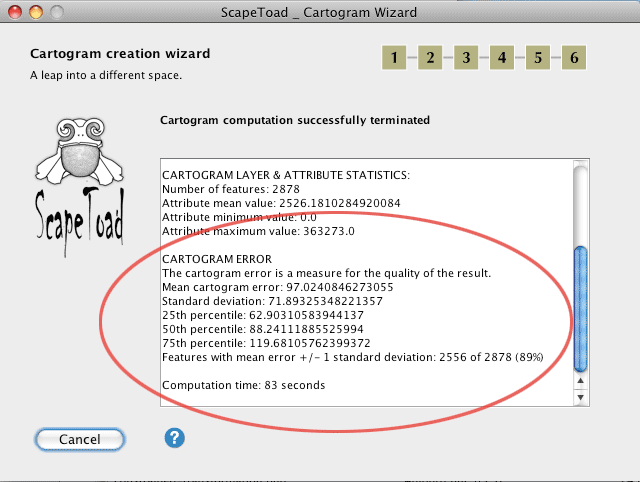
3 - Cartogram error indicators
The third part of the log shows several indicators evaluating the quality of the produced cartogram.
Ath/A is determined for each cartogram polygon, where Ath is the theoretical area that the polygon should have to be proportional to its value of the statistical variable, and where A is its effective area. Expressed in %, the result can be interpreted as follows:
- A value inferior to 100% means that the polygon is larger than it should be. E.g. the area of a feature with an Ath/A value of 80% should be reduced by 20% to be exactly proportional to its value of the statistical variable. [1.00/1.25 = 0.80 ; 1.00/(1.25-0.20×1.25) = 1.00]
- A value superior to 100% mans that the polygon is smaller than it should be. E.g. the area of a feature with an Ath/A value of 120% should be reduced by 20% to be exactly proportional to its value of the statistical variable.
- Mean cartogram error: Arithmetic average of theAth/A indicator for all features.
- Standard deviation: Standard deviation of the Ath/A indicator for all features.
- For percentile calculation, features have been ordered by their Ath/A values. The log shows the following percentiles:
- 25th percentile: 25% of the features have an Ath/A value inferior to this number.
- 50th percentile (or median): 50% of the features have an Ath/A value inferior to this number.
- 75th percentile: 50% of the features have an Ath/A value inferior to this number.
- Features with mean error +/- 1 standard deviation: Number of features with an Ath/A diverging form average error by less than one standard deviation.
- Computation time: Difference between computation start-time and computation end-time.